I love Python but sadly the best way to do GIS data is to use R and Leaflet. There are no one way to make an interactive map but here are a few steps that I would use:
Pre-Processing:
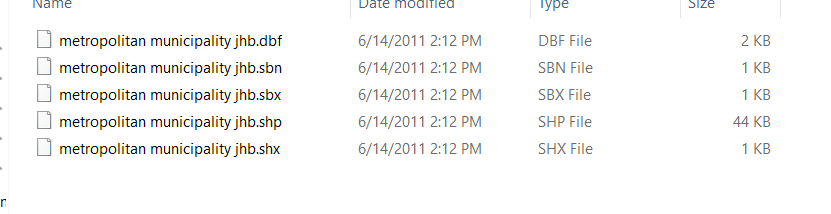
- Acquire the necessary shapefile: This step can often take longer than you think. Governments are frequently the source of the shapefile since they’re the ones who usually employ the surveyors + engineers necessary to build the file. https://census2011.adrianfrith.com/place/798 (Place where I acquired the necessary files to do my project on Johannesburg.)
- Dealing with these files can often be intimidating because they are stored in extremely strange formats. Example a .kml file is a file used by Google Earth but can be converted into a ‘.shp’ file format.
- The best way to work with any GIS related files is with QGIS.
- Joining your shapefile (or whichever file type you settle on) with a text file with the same unique identifier. The reason why we’re doing this is so that we can display the data that is associated with the geographical boundary or point.
- Here’s another thing to consider while you prepare your map. Are you going to display geographical boundaries, example: voting precinct, or points on a map?
- If you need geographical boundary, that data most likely lives in a shapefile, if you need points on a map you can usually import that from a .csv file with lat long coordinates.
Leaflet:
Leaflet is a package for R. I’m not going to teach you all to use R in this point (maybe a future post) but I will run you through some of the stuff I found difficult and soon enough you’ll be off making maps that look as great as the one below.
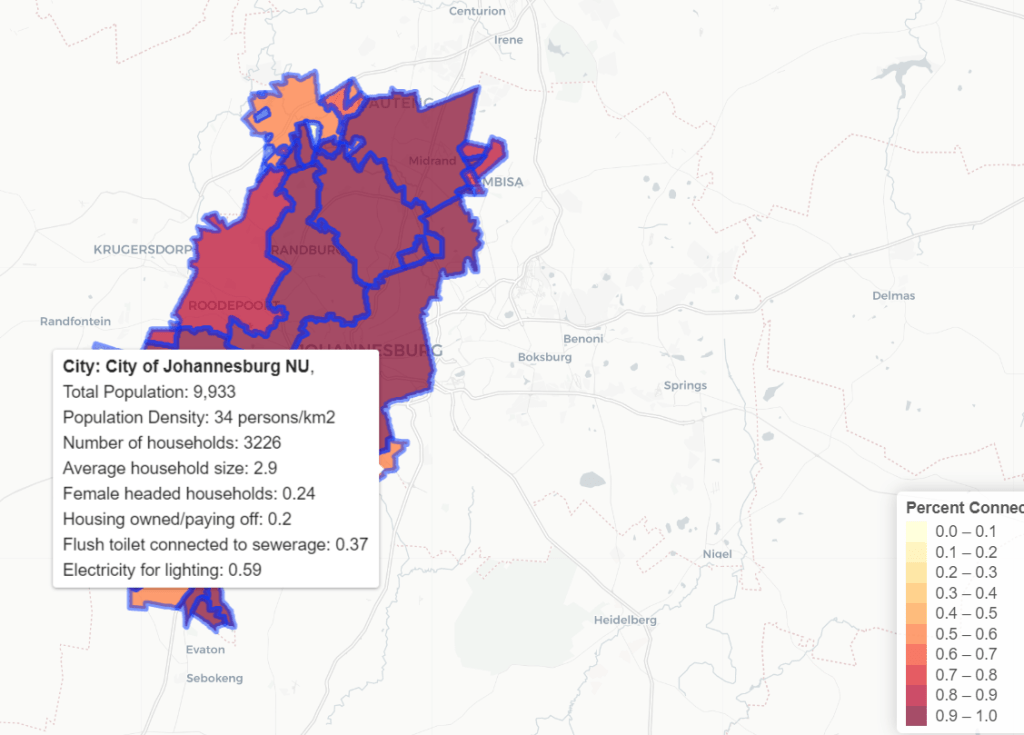
Most of the stuff you can teach yourself by copying the code on the R Leaflet site but the part I found most difficult was the labeling system. Labels are important because they allow you to display attribute data for geographical boundaries. How many people live in a district, what’s the poverty rate in district?
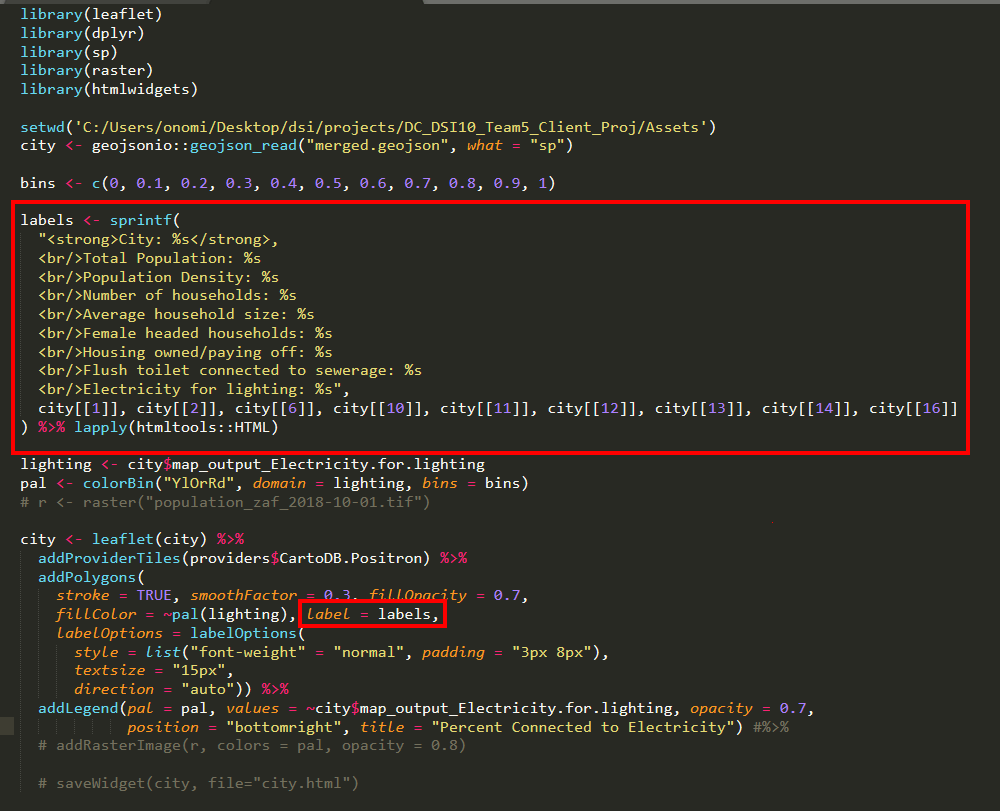
Here’s the full code to this map. Notice how I’m creating a list of display labels and R subsections to build a label object. In R, to access part of the data you can use ‘city[[1]]’ to access the first column in the dataframe. Then to label the column notice how we’re using a ‘%s’ to indicate that we’re summoning a string object in the label object. Notice how we’re using the word “City” before the ‘%s’ to indicate what string we’d like to display before the dynamic string.
I could spend pages, spelling step by step explaining how to build a leaflet map for R using QGIS but I think I’ll let you try this by yourself. The only way to truly get good at GIS by trial and error but I hope I’ve done enough to explain some of the more difficult concepts.
